Channel Dashboard / Home
Home Tab
Home Tab
Home Tab
Home Tab
Home Tab
Home Tab
As the default tab once the user signs or logs in, the Home tab provides an overview their violet performance. Using key metrics on bags, orders and merchants, the user can analysis their performance and track Merchant's ranking and connection health.
As the default tab once the user signs or logs in, the Home tab provides an overview their violet performance. Using key metrics on bags, orders and merchants, the user can analysis their performance and track Merchant's ranking and connection health.
As the default tab once the user signs or logs in, the Home tab provides an overview their violet performance. Using key metrics on bags, orders and merchants, the user can analysis their performance and track Merchant's ranking and connection health.
As the default tab once the user signs or logs in, the Home tab provides an overview their violet performance. Using key metrics on bags, orders and merchants, the user can analysis their performance and track Merchant's ranking and connection health.
As the default tab once the user signs or logs in, the Home tab provides an overview their violet performance. Using key metrics on bags, orders and merchants, the user can analysis their performance and track Merchant's ranking and connection health.
As the default tab once the user signs or logs in, the Home tab provides an overview their violet performance. Using key metrics on bags, orders and merchants, the user can analysis their performance and track Merchant's ranking and connection health.
Scope
Enable users to review their Violet Account performance at a glance per day or in specific timeframes.
Problem
Previously, users had to navigate multiple tabs to gather and review metrics on Bags, Offers, and Merchant's Connection Health Status.
Solution
Generated and presented data on Bags, Offers, and Merchant's Connection Health Status in a dashboard format, allowing users to easily filter data by date without navigating multiple tabs.
Overview
Overview
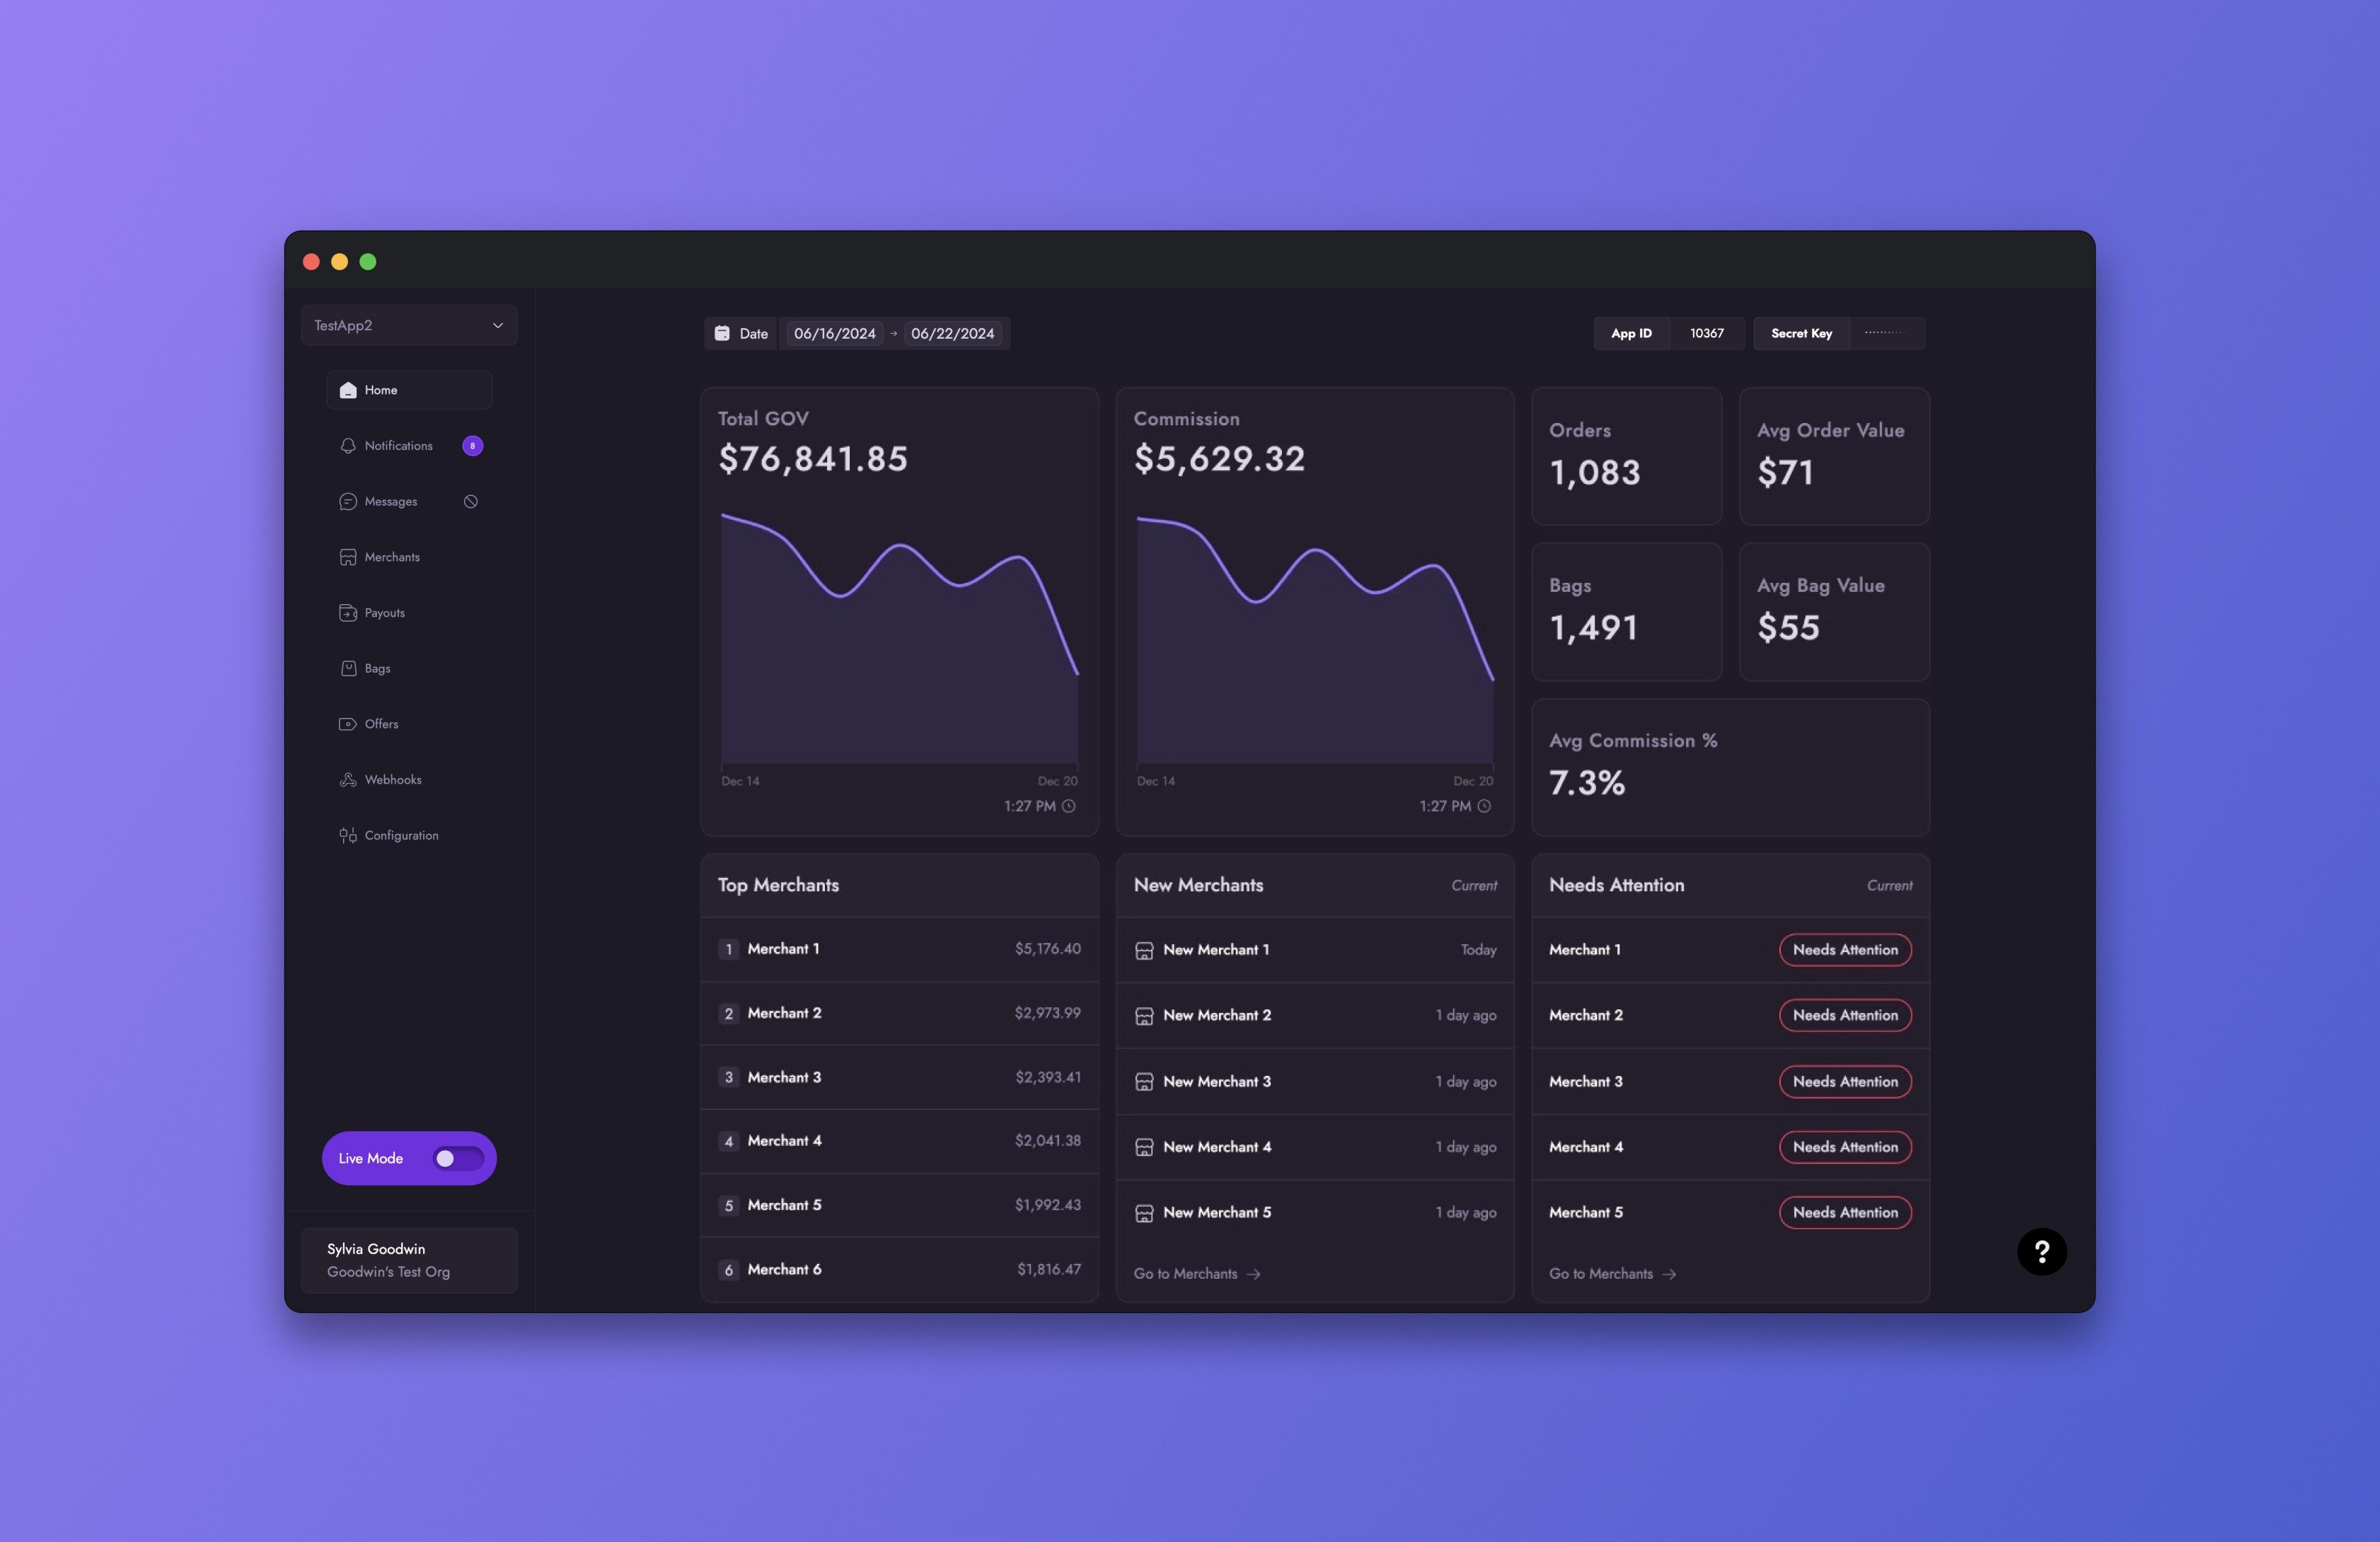
The Home tab was designed to provide the user with their Violet performance summary without requiring specialized analytics resources found in the dashboard. To help the user understand their performance, the Home tab displayed metrics on gross order value (GOV), commission rate, revenue and average values of bags and orders. In addition, top and new merchants are highlighted along side poor merchant health connection statues which require the user's attention.
The Home tab was designed to provide the user with their Violet performance summary without requiring specialized analytics resources found in the dashboard. To help the user understand their performance, the Home tab displayed metrics on gross order value (GOV), commission rate, revenue and average values of bags and orders. In addition, top and new merchants are highlighted along side poor merchant health connection statues which require the user's attention.
Requirements
Requirements
Required Data:
Total GOV
Commission
Order count
Average order value
Bags count
Average bag value
Top Merchants
New Merchants
Needs Attention
Date filter
App ID and Secret Key
Required Functionally:
Interactive charts
Date Filter
Required Data:
Total GOV
Commission
Order count
Average order value
Bags count
Average bag value
Top Merchants
New Merchants
Needs Attention
Date filter
App ID and Secret Key
Required Functionally:
Interactive charts
Date Filter
Interface
Interface
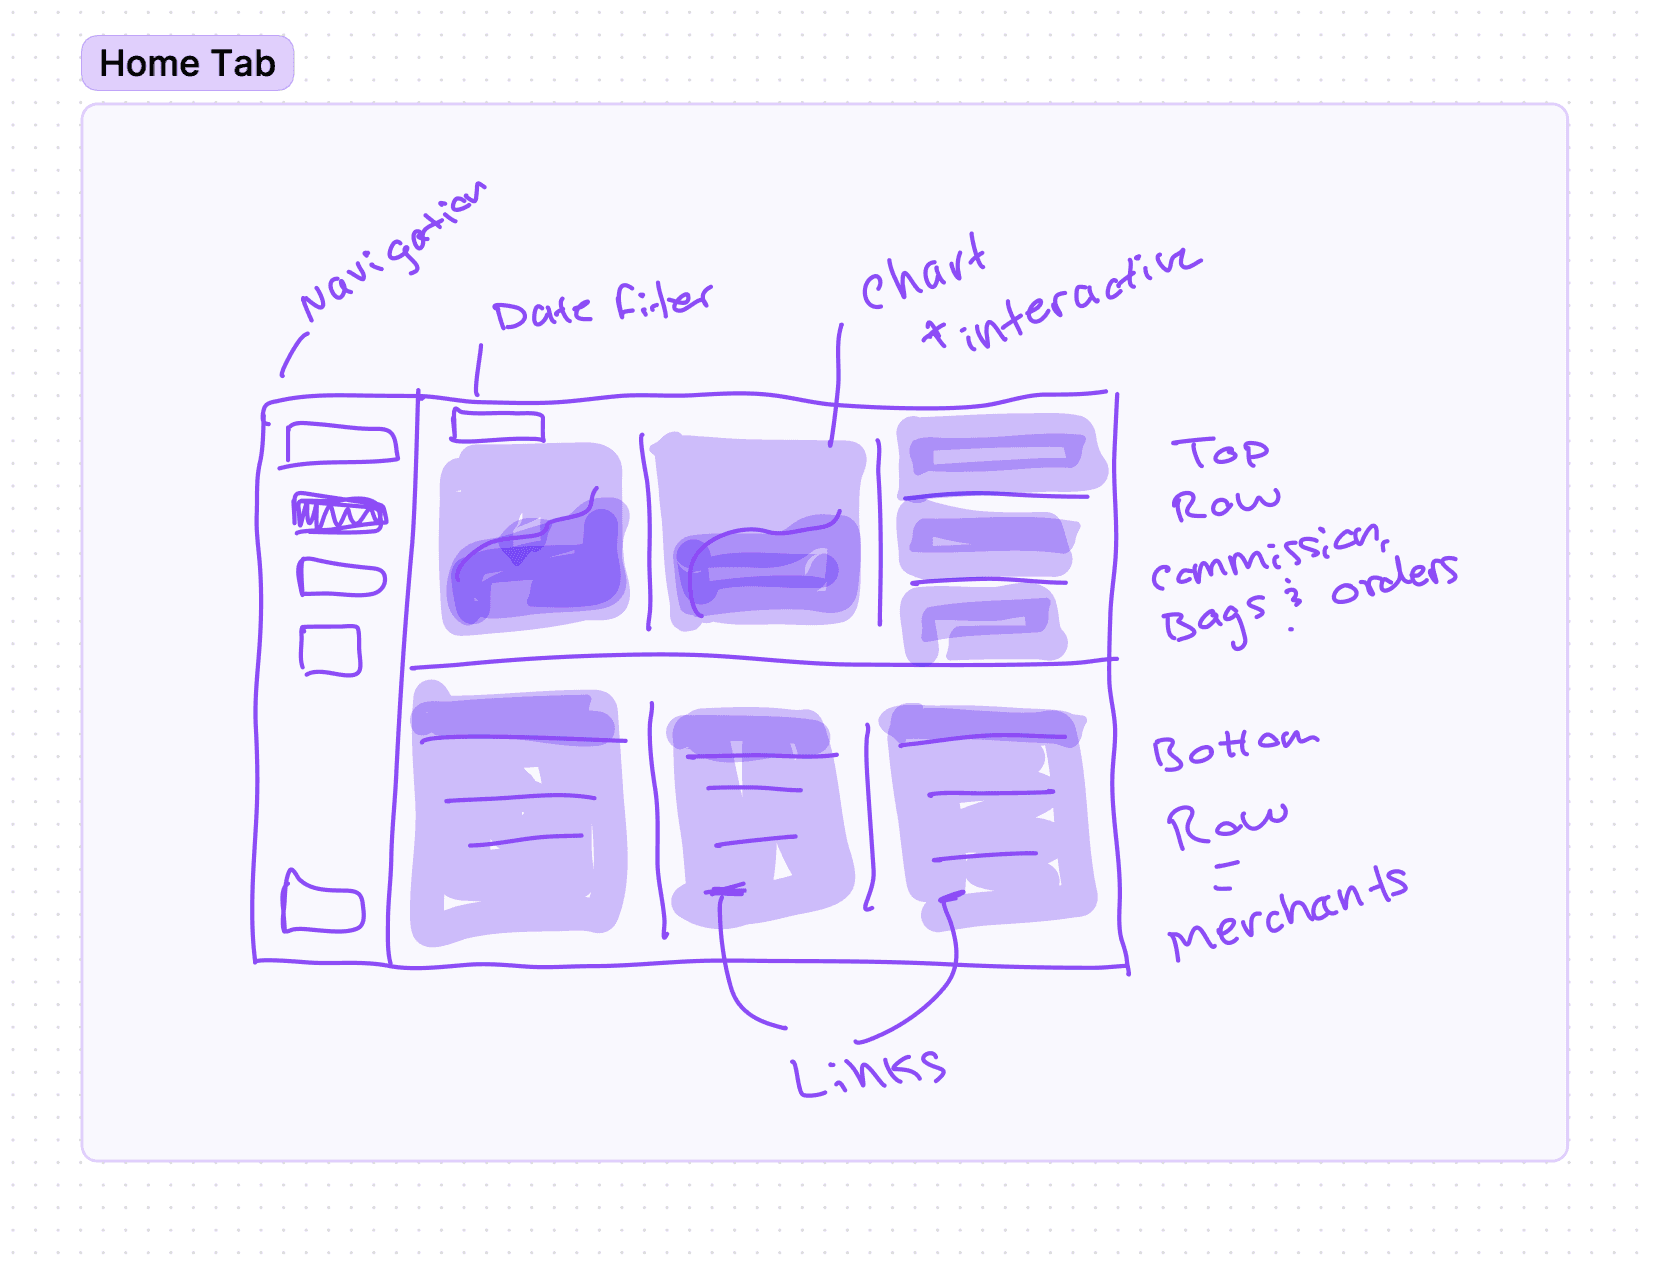
For this feature, a large amount of my time was spent on iterations of wireframes to determine layout options and how to display each data metric. Maintaining visual balance was the secondary goal to the data itself. To balance the metics, a layout of two main rows was selected.
The top row contained data on commission, bags and orders. Here the user could interact with two charts, GOV and Commission. Above this row is the date filter which controlled the data shown.
The bottom row contained three cards all related to Merchants. The first card is Top Merchants which rank merchants 1 - 10. The second is New Merchants, capturing when merchants joined. And the third card is Needs Attention. Needs Attention consists of three health statuses of merchants: Complete, Incomplete and Needs Attention. The Needs Attention health status is highlighted on this tab to ensure user's addressed the issue.


Details
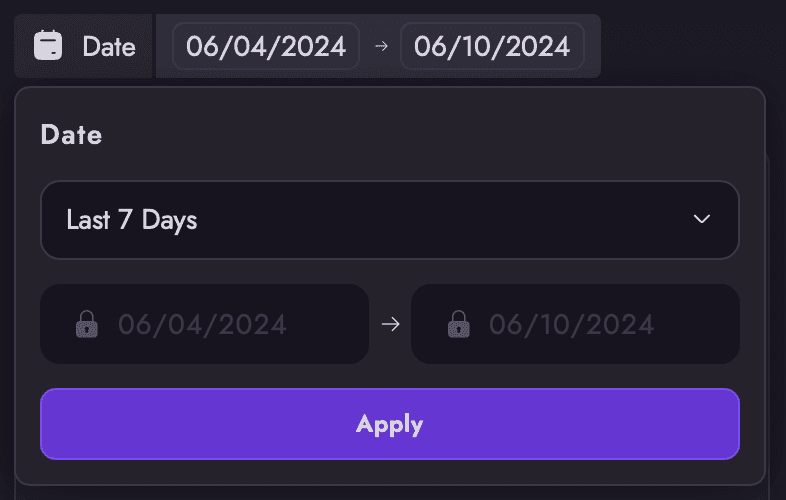
The filter date ranges include:
- Last 7 Days
- This Month
- Last Month
- Last 4 Weeks
- This Quarter
- Last 3 Months
- This Year
- Last 12 Months
Below the date range of 'Last 7 Days' are two inputs with lock icons. These inputs were disabled as their sole purpose was to display the range selected above.

Details
The filter date ranges include:
- Last 7 Days
- This Month
- Last Month
- Last 4 Weeks
- This Quarter
- Last 3 Months
- This Year
- Last 12 Months
The filter date ranges include:
- Last 7 Days
- This Month
- Last Month
- Last 4 Weeks
- This Quarter
- Last 3 Months
- This Year
- Last 12 Months
Below the date range of 'Last 7 Days' are two inputs with lock icons. These inputs were disabled as their sole purpose was to display the range selected above.
Below the date range of 'Last 7 Days' are two inputs with lock icons. These inputs were disabled as their sole purpose was to display the range selected above.


Outcome
The Home tab displays key metrics clearly and concisely, ensuring users can easily access important information without feeling overwhelmed.
Details
The filter date ranges include:
- Last 7 Days
- This Month
- Last Month
- Last 4 Weeks
- This Quarter
- Last 3 Months
- This Year
- Last 12 Months
Below the date range of 'Last 7 Days' are two inputs with lock icons. These inputs were disabled as their sole purpose was to display the range selected above.


Outcome
The Home tab displays key metrics clearly and concisely, ensuring users can easily access important information without feeling overwhelmed.
Up Next!

Notifications
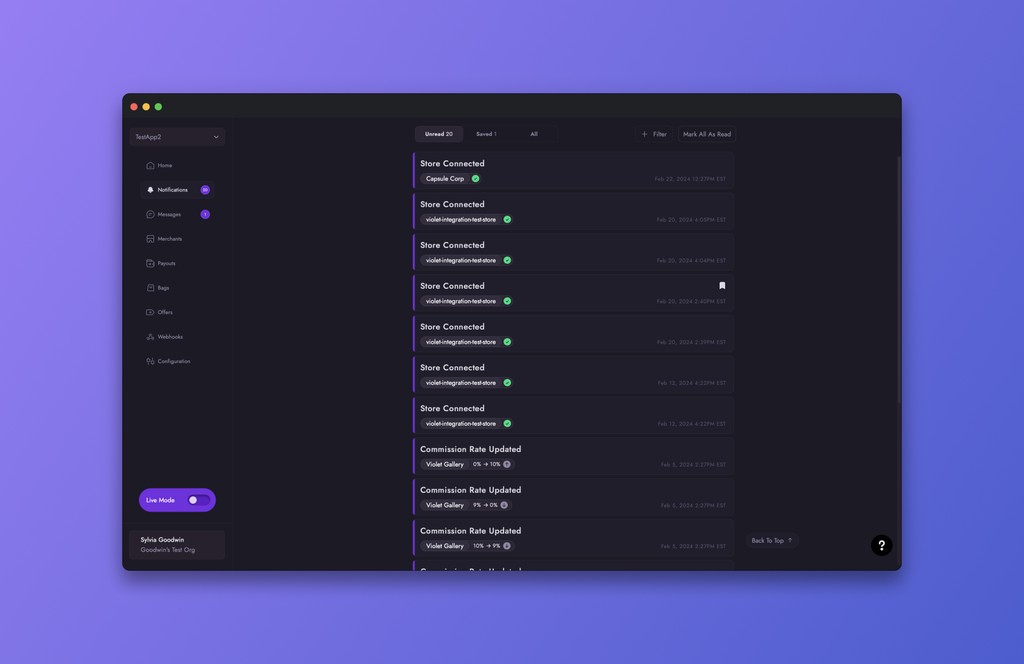
Stay informed with instant updates inside your Channel Dashboard, designed to keep you aware of all critical activities and developments.
Up Next!


Notifications
Stay informed with instant updates inside your Channel Dashboard, designed to keep you aware of all critical activities and developments.
Up Next!


Notifications
Stay informed with instant updates inside your Channel Dashboard, designed to keep you aware of all critical activities and developments.
Details
The filter date ranges include:
Last 7 Days
This Month
Last Month
Last 4 Weeks
This Quarter
Last 3 Months
This Year
Last 12 Months
Below the date range of 'Last 7 Days' are two inputs with lock icons. These inputs were disabled as their sole purpose was to display the range selected above.


Up Next!


Notifications
Stay informed with instant updates inside your Channel Dashboard, designed to keep you aware of all critical activities and developments.
